IIT Kanpur AI ML DL Reference Materials IITKAIRef
Go to Main Page IIT Kanpur AI Course
=================
AItoday : Temporary page for content of the day https://brahmavad.in/aitoday/
Some Mathematical Concepts : https://brahmavad.in/iitkaimaths/
AI ML DL : To benefit from The course we will need some good grounding on mathematics
Some of concepts of Mathematics and Statistics will serve as the foundation for this course.
Lets learn, revise, conosolidate those concepts here https://brahmavad.in/iitkaimaths/
IIT KANPUR AI ML DL Course Reference Videos
https://brahmavad.in/iitkairefvid/
Date 12 June 2025
Navigate the Page Date wise
Dates

June 12 2025 : Date12062025 Click here

June 13 2025 : Date13062025 Click Here

June 14 2025 : Date14062025 Click here. ( BREAK )
June 15 2025 : Date15062025 Click here. ( BREAK )
June 16 2025 : Date16062025 Click here
June 17 2025 : Date17062025 Click here
June 18 2025 : Date18062025 Click here ( BREAK )
June 19 2025 : Date19062025 Click here
June 20 2025 : Date20062025 Click here
June 21 2025 : Date21062025 Click here ( BREAK )
June 22 2025 : Date22062025 Click here ( BREAK )
June 23 2025 : Date23062025 Click here
June 24 2025 : Date24062025 Click here ( BREAK )
June 25 2025 : Date25062025 Click here ( BREAK )
June 26 2025 : Date26062025 Click here
June 27 2025 : Date27062025 Click here
June 12 2025 : Date12062025

TOPICS FOR DATE 12 JUNE : AI1206
Back to top of page
\
| 12th June, 2025 | |
| 06:00 PM – 7:30 PM | Lecture 8: Data Clustering for Machine Learning • K-Means Algorithm • Centroid Computation • Cluster Assignment • Elbow Method for Number of Clusters • Silhouette Score |
| 7:30 PM-8:00 PM | Break |
| 8:00 PM – 09:15 PM | Project 7: Discriminant Based Data Classification using IRIS Data Set • IRIS Dataset Features • LDA Model Fitting • Performance Visualization |
Algorithms
Iterative In Nature
Data Set of n Dimensional Vectors
Unsupervised Learning. Raw Data are not labelled.
M Numbers of Vectors
Clusters.
Organise the data into K Clusters
K Denotes number of Clusters.
Centroids for these Clusters are
Mu Bar1
Object Centre or Capital
Circumcentre , Ortho Centre
Cluster Assignment :
When it’s 1 :
Alph
Point cannot belong to Multiple Clusters
But Only One Cluster
—
Each point is assigned only to a single Cluster
Tirds point is assigned to Cluster to Cluster 2
Are you able to
We cannot have overlapping Clusters
Page 9
COST Function
SSE Sum
Distance of Particlar Point from Centroid , , Squre that and Take the Sum
Sum of Squared Errors
SSE
Its shows the Tightness, Simimlarities
Minimise distance
Each point
Error Sum of Squares (SSE)
https://hlab.stanford.edu/brian/error_sum_of_squares.html
Iterative Algorithm
Can’t get solution in one step
First let us
assume
Centtroids in iteration L-1
Divyansh Bharti . Kushagra Khanna , Summana, Sanjeev Krishna ( They understand better than most )
How to chose particualr Cluster
Closest to Point X Bar
Ass
Page 11
value of Cluster assignemnt Indictor
Kirirttiaa Chatterjee solved .
Calcuate the Distance w,rt
https://scikit-learn.org/stable/modules/clustering.html
Page 14
Centroid Determination
Derermine the centroid
Choose the centroid SUM squre is Mimumum
Page 20
After Few iterations Clusters & Centroids Converge (?)
23
NO of CLusters
Elbow Technqique
Silhoutte Score
Where Silhoutte Score
https://developers.google.com/machine-learning/intro-to-ml#classification
Clustering in Machine Learning Codecademy
Silhouette Score, Inliers, and Outliers
Getting Started with Orange 13: Silhouette
Getting Started with Orange 11: k-Means
k-means Elbow Method and Silhouette Method
Kunaal Naik | Data Science Masterminds
Data clustering, a fundamental technique in machine learning, involves grouping similar data points into clusters based on their characteristics. It’s an unsupervised learning method, meaning it doesn’t require labeled data to train. Clustering finds patterns, identifies hidden structures, and provides insights into data organization.
Unsupervised Learning:
Clustering is an unsupervised method, meaning it can analyze data without predefined labels or classes

- K-Means Algorithm
- K-Means Clustering is an Unsupervised Machine Learning algorithm which groups unlabeled dataset into different clusters. It is used to organize data into groups based on their similarity.


For example online store uses K-Means to group customers based on purchase frequency and spending creating segments like Budget Shoppers, Frequent Buyers and Big Spenders for personalised marketing.
The algorithm works by first randomly picking some central points called centroids and each data point is then assigned to the closest centroid forming a cluster. After all the points are assigned to a cluster the centroids are updated by finding the average position of the points in each cluster. This process repeats until the centroids stop changing forming clusters. The goal of clustering is to divide the data points into clusters so that similar data points belong to same group.
Centroid-based clustering
The centroid of a cluster is the arithmetic mean of all the points in the cluster. Centroid-based clustering organizes the data into non-hierarchical clusters. Centroid-based clustering algorithms are efficient but sensitive to initial conditions and outliers. Of these, k-means is the most widely used. It requires users to define the number of centroids, k, and works well with clusters of roughly equal size.

Figure 1: Example of centroid-based clustering.
Cluster assignment involves grouping data points into clusters based on similarity, a key task in unsupervised machine learning. It’s used to identify patterns in unlabeled data, like customer segmentation or stock market clustering. The assignment process depends on the chosen clustering algorithm, such as K-means, DBSCAN, or hierarchical clustering
Cluster assignment is used to assign data to the clusters that were previously generated by some clustering methods such as K-means, DBSCAN (Density-Based Spatial Clustering of Applications with Noise), SOM (Self-Organizing Maps), and GMM (Gaussian Mixture Model).
The goal is to identify the point where the rate of decrease in WCSS sharply changes, indicating that adding more clusters (beyond this point) yields diminishing returns. This “elbow” point suggests the optimal number of clusters

Elbow Method in K-Means Clustering
In K-Means clustering, we start by randomly initializing k clusters and iteratively adjusting these clusters until they stabilize at an equilibrium point. However, before we can do this, we need to decide how many clusters (k) we should use.
The Elbow Method helps us find this optimal k value. Here’s how it works:
- We iterate over a range of k values, typically from 1 to n (where n is a hyper-parameter you choose).
- For each k, we calculate the Within-Cluster Sum of Squares (WCSS).
WCSS measures how well the data points are clustered around their respective centroids. It is defined as the sum of the squared distances between each point and its cluster centroid:
WCSS=∑i=1k∑j=1nidistance(xj(i),ci)2WCSS=∑i=1k∑j=1nidistance(xj(i),ci)2
where,
distance(xj(i),ci)distance(xj(i),ci)represents the distance between the j-th data point xj(i)xj(i) in cluster i and the centroid ciciof that cluster.
The Elbow Point: Optimal k Value
The Elbow Method works in below steps:
- We calculate a distance measure called WCSS (Within-Cluster Sum of Squares). This tells us how spread out the data points are within each cluster.
- We try different k values (number of clusters). For each k, we run KMeans and calculate the WCSS.
- We plot a graph with k on the X-axis and WCSS on the Y-axis.
- Identifying the Elbow Point: As we increase kkk, the WCSS typically decreases because we’re creating more clusters, which tend to capture more data variations. However, there comes a point where adding more clusters results in only a marginal decrease in WCSS. This is where we observe an “elbow” shape in the graph.
- Before the elbow: Increasing kkk significantly reduces WCSS, indicating that new clusters effectively capture more of the data’s variability.
- After the elbow: Adding more clusters results in a minimal reduction in WCSS, suggesting that these extra clusters may not be necessary and could lead to overfitting.
..
The Silhouette Score is a metric used in machine learning to evaluate the quality of clustering results. It quantifies how well each data point is clustered within its own cluster and how well it is separated from neighboring clusters. A higher Silhouette Score indicates that data points are well clustered and well-separated.
Key Concepts:
- Silhouette Coefficient:
This measures how similar a data point is to its own cluster compared to other clusters. It ranges from -1 to 1
Silhouette Coefficient
In subject area: Computer Science
Silhouette coefficient is a metric used to evaluate the quality of clustering in computer science. It measures the coherence of clusters, with a higher coefficient indicating more coherent clusters. The coefficient ranges from -1 to 1, with values close to +1 indicating that a sample is far away from neighboring clusters, and negative values suggesting that samples may have been assigned to the wrong cluster. The coefficient is calculated based on cluster cohesion and cluster separation, which represent the average distances between instances and data points within and between clusters, respectively.
Back to top of page
June 13 2025 : Date13062025

Tools
https://www.omnicalculator.com/math/log-2
Reference Books & Videos :
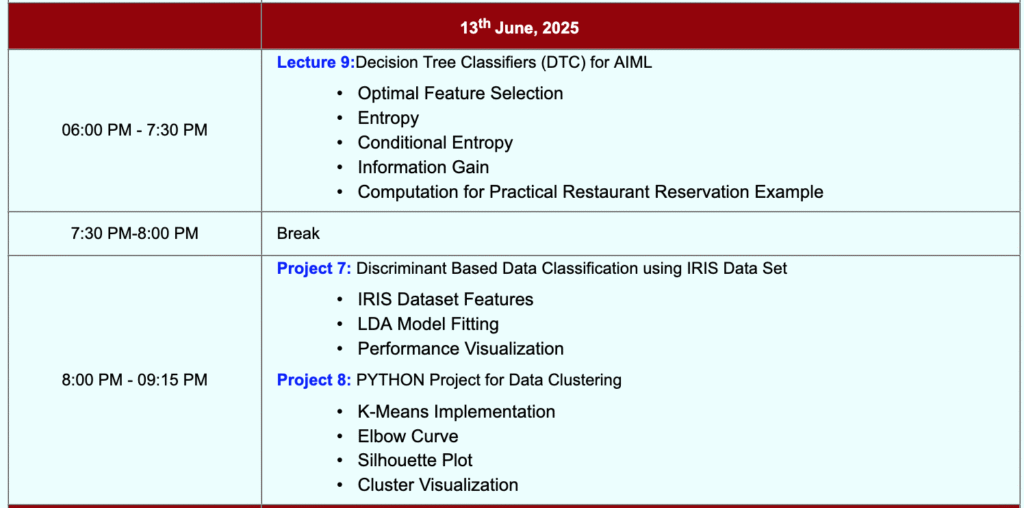
| 13th June, 2025 | |
| 06:00 PM – 7:30 PM | Lecture 9:Decision Tree Classifiers (DTC) for AIML • Optimal Feature Selection • Entropy • Conditional Entropy • Information Gain • Computation for Practical Restaurant Reservation Example |
| 7:30 PM-8:00 PM | Break |
| 8:00 PM – 9:15 PM | Project 8: PYTHON Project for Data Clustering • K-Means Implementation • Elbow Curve • Silhouette Plot • Cluster Visualization |
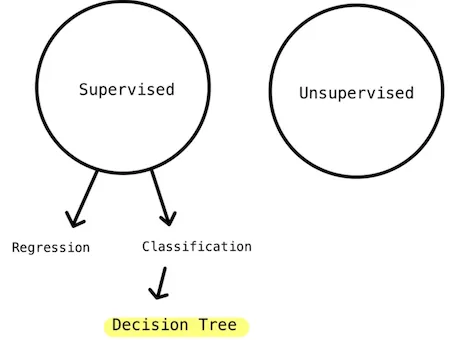
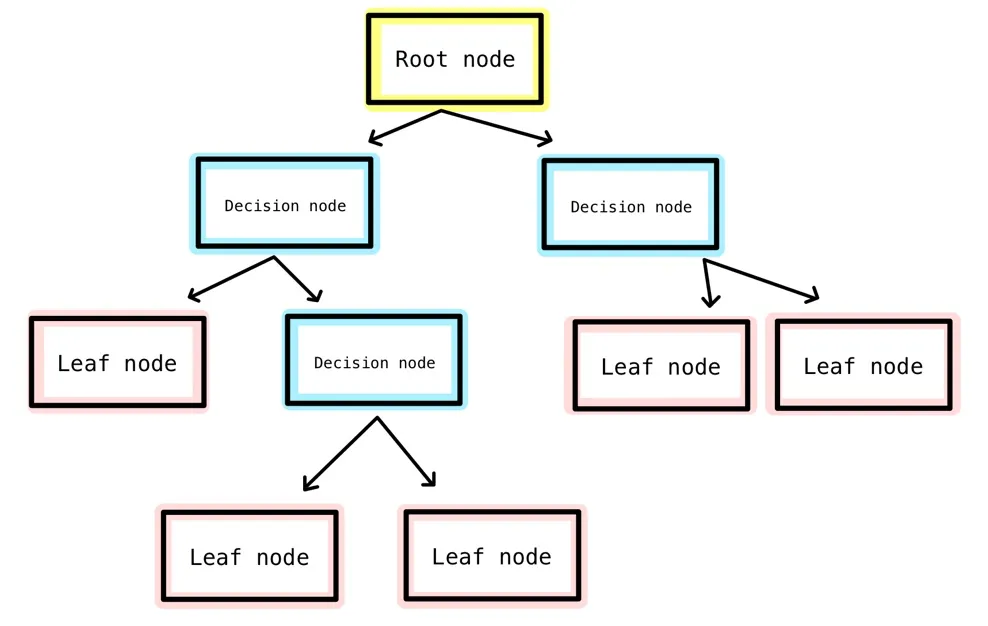
Decision Tree
Decision tree is ( A) intuitive and (B) easy to understand.
A set of Yes/No or if/else questions.
Below is a typical diagram of decision tree.
https://medium.com/codex/decision-tree-for-classification-entropy-and-information-gain-cd9f99a26e0d
Source :
https://medium.com/@chyun55555/decision-tree-classifier-with-scikit-learn-from-python-e83f38079fea
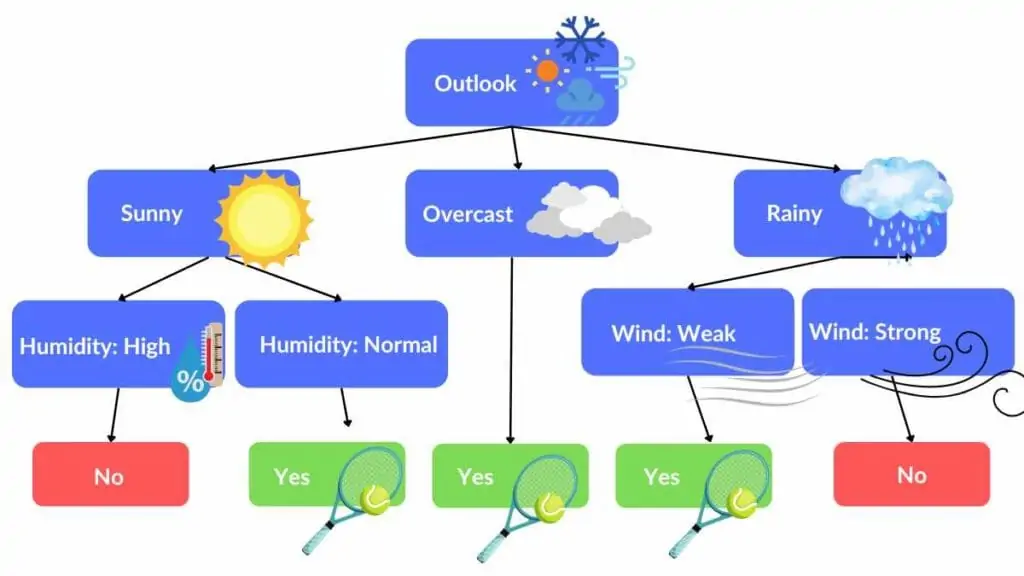
This decision tree
Visual representation of how decisions are made based on the feature values.
Each path from the root to a leaf represents a series of decisions leading to a final prediction.
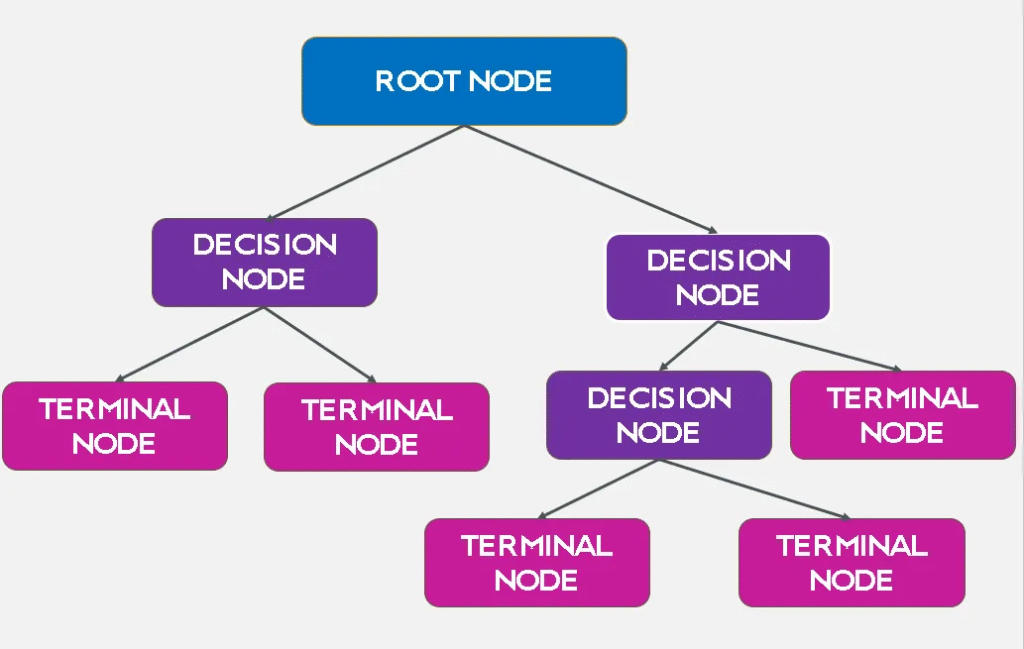
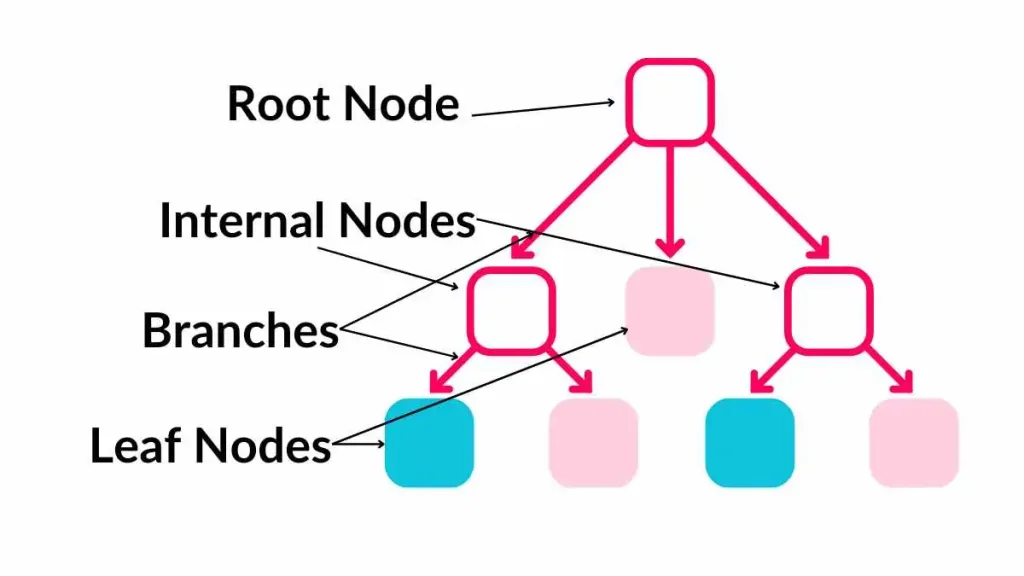
Components of a Decision Tree:
- Root Node: The topmost node in a decision tree. It represents the entire dataset and is split into two or more homogeneous sets.
- Internal Nodes: Nodes within the tree that represent decision points. Each internal node corresponds to an attribute test.
- Leaf Nodes (Terminal Nodes): Nodes at the end of the branches, which provide the outcome of the decision path. For classification tasks, they represent class labels. For regression, tasks represent continuous values.
- Branches: Arrows connecting nodes, representing the outcome of a test and leading to the next node or leaf.
2. Splitting Criteria
Splitting the data is a crucial part of building a decision tree. Various criteria can be used to determine the best split:
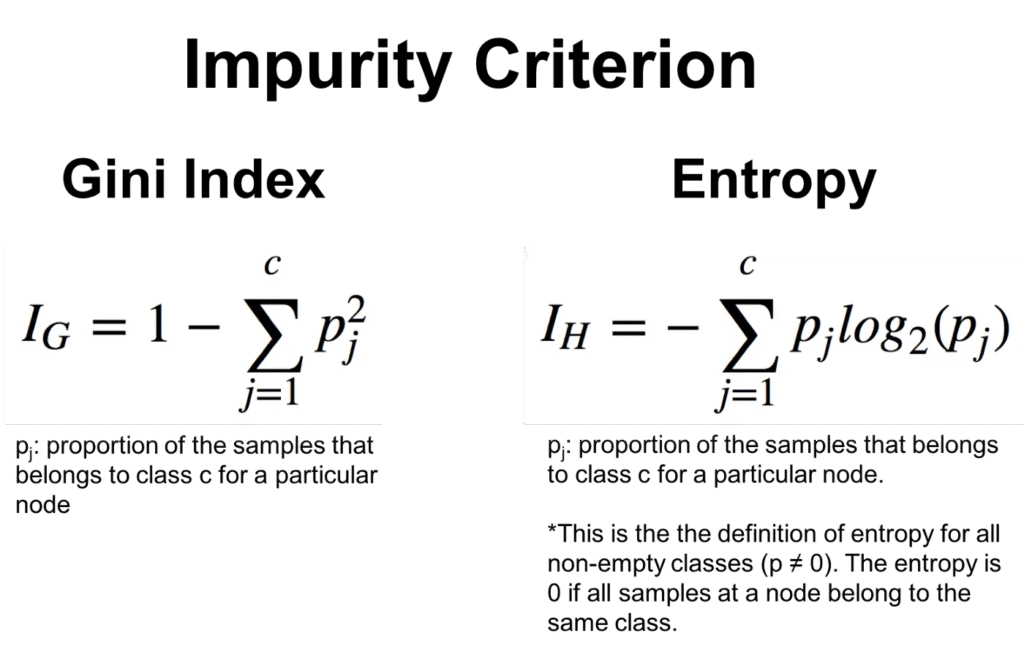
- Gini Impurity: Measures the frequency at which a randomly chosen element would be incorrectly classified. A lower Gini impurity indicates a purer node.
- Entropy (Information Gain): Measures the unpredictability or disorder. Information gain is used to decide the optimal split by reducing entropy the most.
- Variance Reduction: Used for regression trees to measure the reduction in variance for the dependent variable.
Source
https://spotintelligence.com/2024/05/22/decision-trees-in-ml
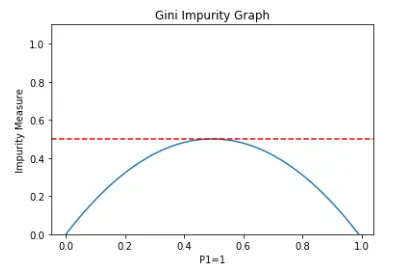
Gini Impurity is a measurement of the likelihood of an incorrect classification of a new instance of a random variable, if that new instance were randomly classified according to the distribution of class labels from the data set.
A Gini Impurity of 0 is the lowest and best possible impurity. It can only be achieved when everything is the same class.
Back to top of page
June 14 2025 : Date14062025

Back to top of page
Back to top of page
June 15 2025 : Date15062025

Back to top of page
Back to top of page
June 16 2025 : Date16062025
Back to top of page
AS on 13 JUNE 2025
| Week-3 | |
| 16th June, 2025 | |
| 06:00 PM – 7:30 PM | Lecture 10: Introduction to Neural Networks (NNs)
|
| 7:30 PM-8:00 PM | Break |
| 8:00 PM – 9:15 PM | Project 9: Building a DTC for IRIS Dataset using PYTHON
Project 10: Decision Tree Classifier using for Purchase Logistic Data Set
|
OLD SCHEDULE
| Week-3 | |
| 16th June, 2025 | |
| 06:00 PM – 7:30 PM | Lecture 10: Introduction to Neural Networks (NNs) • Neuron Structure and Properties • ANN Model • Activation Functions • One Hot Encoding • Categorical Crossentropy |
| 7:30 PM-8:00 PM | Break |
| 8:00 PM – 9:15 PM | Project 9: Building a DTC for IRIS Dataset using PYTHON • IRIS Dataset Features • DTC Model Fitting • Accuracy Score • Confusion Matrix |
Artificial Neural Network (ANN)
Uses some of this Functions for Activation
Sigmoid | ReLU (Rectified Linear Unit) | Tanh (Hyperbolic Tangent) | Softmax |
Sigmoid |
The Sigmoid Function Clearly Explained
ReLU (Rectified Linear Unit) |
Mastering ReLU & Leaky ReLU Activation Functions | Rectified Linear Unit (ReLU) |Hindi Tutorial
Tanh (Hyperbolic Tangent) |
5. Tanh Activation Function | ACTIVATION FUNCTION
Softmax |
SoftMax Activation Function in Neural Networks SoftMax function Solved example by Mahesh Huddar
Softmax Activation Function || Softmax Function || Quick Explained || Developers Hutt
One-hot Encoding explained deeplizard 161K subscribers
Quick explanation: One-hot encoding
Cross Entropy Udacity
Categorical Cross Entropy Explained | Beginner’s Guide | Loss functions DataMites
Categorical Cross Entropy | Artificial Neural Networks Gate Sma
Back to top of page
June 17 2025 : Date17062025
Back to top of page
UPDATED SCHEDULE as on 13 June 2025
| 17th June, 2025 | |
| 06:00 PM – 7:30 PM | Leture 11: Deep Learning and Deep Neural Nets
|
| 7:30 PM-8:00 PM | Break |
| 8:00 PM – 9:15 PM | Distinguished Guest Lecture I: Dr. Dhananjay Ram, Senior Applied Scientist Amazon Web Services (AWS), Novel Architectures for LLM Bellevue, Washington, United States |
| 17th June, 2025 | |
| 06:00 PM – 7:30 PM | Leture 11: Deep Learning and Deep Neural Nets • Multi-layer Neural Networks • DNN Models • Dense and Sequential Architectures • NN Notation • Multi-layer Neural Nets • Gradient Descent • Backpropagation • Dropout Layers |
| 7:30 PM-8:00 PM | Break |
| 8:00 PM – 9:15 PM | Project 10: Decision Tree Classifier using for Purchase Logistic Data Set • Purchase Dataset Features • DTC Visualization • DTC Prediction • Performance Metrics |
Back to top of page
June 18 2025 : Date18062025

Back to top of page
| 18th June, 2025 | |
| Break Day |
Back to top of page
June 19 2025 : Date19062025
Back to top of page
| 19th June, 2025 | |
| 06:00 PM – 7:30 PM | Project 11: PYTHON-based Neural Network using PYTHON for Boston Housing Dataset • Boston Dataset Features • Sequential NN Model • Model Fitting • Training Epochs • Accuracy Performance |
| 7:30 PM-8:00 PM | Break |
| 8:00 PM – 9:15 PM | Lecture 12: Convolutional Neural Networks (CNNs) • CNN Architectures • Convolution • Dot Product, • Padding • Hierarchical Structure • Max/ Average Pooling |
Back to top of page
June 20 2025 : Date20062025
Back to top of page
Back to top of page
| 20th June, 2025 | |
| 06:00 PM – 7:30 PM | Project 12: Neural Network for analysis of Mobile Prices Dataset • Dataset Features • One Hot Encoding • Data Scaling • NN Model • Crossentropy • Adam Optimizer • Plots of Loss and Accuracy |
| 7:30 PM-8:00 PM | Break |
| 8:00 PM – 9:15 PM | Test prep 1:Test preparation 1 • Interview problem solving session • Solution discussion |
—
Back to top of page
June 21 2025 : Date21062025

Back to top of page
Break
Back to top of page
Back to top of page
June 22 2025 : Date22062025

Back to top of page
Break
Back to top of page
Back to top of page
June 23 2025 : Date23062025
Back to top of page
| Week-4 | |
| 23rd June, 2025 | |
| 06:00 PM – 7:30 PM | Distinguished Guest Lecture I: Dr. Karthikeyan Shanmugam, Research Scientist at Google DeepMind India (Bengaluru) |
| 7:30 PM-8:00 PM | Break |
| 8:00 PM – 9:15 PM | Project 13: Deep Learning for Fashion Classification using the MNIST Fashion Data Set • Fashion MNIST (Modified National Institute of Standards and Technology) Dataset Description • MNIST Dataset Features and Classes • CNN Modeling • CNN Training • Sparse Categorical Crossentropy • Loss/ Accuracy Plotting Project 14: Deep Learning for Digit Classification using MNIST Digit DataSet • MNIST Handwritten Digit Dataset Features • CNN Architecture • Data Encoding • Softmax Activation • Confusion Matrix • Plots of Loss and Accuracy |
Back to top of page
June 24 2025 : Date24062025
Back to top of page
| 24th June, 2025 | |
| Break Day |
Back to top of page
June 25 2025 : Date25062025
Back to top of page
| 25th June, 2025 | |
| Break Day |
Back to top of page
June 26 2025 : Date26062025
Back to top of page
| 26th June, 2025 | |
| 06:00 PM – 7:30 PM | Project 15: Deep Learning using the CIFAR Dataset • CIFAR-10 dataset (Canadian Institute for Advanced Research, 10 classes) • Dataset Visualization • CNN Architecture • Model Building and Compilation • Classification Accuracy • Confusion Matrix Metrics |
| 7:30 PM-8:00 PM | Break |
| 8:00 PM – 9:15 PM | Test prep 2: Test preparation 2 • Interview problem solving session • Solution discussion |
Back to top of page
June 27 2025 : Date27062025
Back to top of page
| 27th June, 2025 | |
| 06:00 PM – 07:30 PM | Distinguished Guest Lecture II: Dr. Bamdev Mishra, Principal Applied Scientist Microsoft India, Bangalore |
| 7:30 PM-8:00 PM | Break |
| 8:00 PM – 9:15 PM | Project 16: IMDB Dataset and Deep Learning for Movie Rating Classification • Internet Movie Database (IMDb) Dataset Description • Vectorization • Binary Crossentropy • Model Training • Training and Validation Accuracy Plots • Training and Validation Loss Plots |