ITKAIScr IITK IIT Kanpur AI Course Scribble
Back to Main Page IITK AI ML Course https://brahmavad.in/iitkai/
#AI #IITK
Date : 31 May 2025
Class Schedule
PYTHON for Artificial Intelligence Machine Learning and Deep Learning from 1st to 27th June 2025
https://www.iitk.ac.in/mwn/AIML/programme.html
Procedure for Anaconda, Spider, PYTHON installation for windows:
Please note participants are required to use Laptop with PYTHON, installed. Although participants can use any IDE, preferred installation is ANACONDA and Spyder for PYTHON. Detailed stepwise procedure to install ANACONDA Spyder for free on windows platform can be found in document below
Installation document
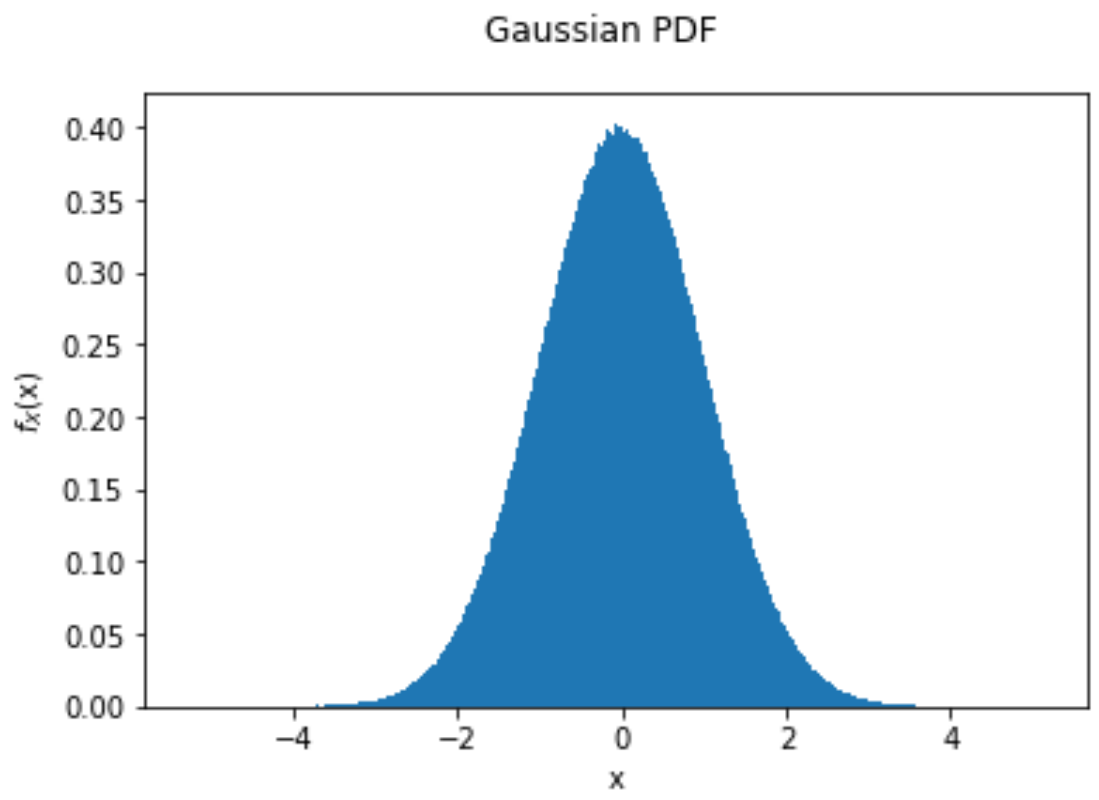
Once Spyder IDE is running, please run this TEST CODE to make sure your installation is working as expected.
The SCREEN SHOT of plot is here
Important Notes: The school is self-contained and includes research style lecture sessions with concepts, problem formulation, algorithms, followed by simulation and verification over practical datasets using PYTHON and various packages such as NUMPY, LINALG, MATPLOTLIB, PANDAS, SCIKIT-LEARN, SEABORN, TENSORFLOW, KERAS.
Participants are also suggested to go through video lectures of Prof. Aditya Jagannatham below to learn more about some of the basic concepts for the school.
Applied Linear Algebra for Signal Processing, Data Analytics and Machine Learning
lass Schedul
Anaconda:
Anaconda is a distribution of Python and a large number of other packages commonly used in data science and machine learning, including libraries like NumPy, SciPy, and pandas. It simplifies package management and environment creation, making it easier to handle dependencies and version conflicts
Anaconda also offers other tools like Jupyter Notebook and Anaconda Navigator.
Spyder:
Spyder is an IDE that is often included with Anaconda, providing an environment for writing, running, and debugging Python code. It is specifically designed for scientific programming, with features like built-in integration with scientific libraries and interactive console.
Spyder is an open-source integrated development environment (IDE) included with Anaconda Distribution that offers advanced editing, interactive testing, debugging, and introspection features. Spyder integrates with popular libraries such as NumPy, SciPy, pandas, and more!
An Integrated Development Environment (IDE) is a software application that provides comprehensive facilities for software development, typically including features like a code editor, compiler, debugger, and version control tools. IDEs streamline the coding process by combining various tools into a single user-friendly interface, making it easier for developers to write, build, test, and debug their code
Key Features and Functionality:
- Code Editor: A text editor with syntax highlighting, code completion, and other features to aid in writing and editing code.
Compiler/Interpreter: Tools that translate the source code into executable instructions.
Debugger: A tool to identify and fix errors in the code.
Build Automation: Features to automate tasks like compiling, linking, and packaging the code.
Version Control Integration: Tools to manage and track changes to the code over time.
Other Tools: Additional features like project management, code refactoring, and profiling
NumPy: short for Numerical Python
A fundamental package for numerical computation in Python. It provides support for large, multi-dimensional arrays and matrices, along with a collection of mathematical functions to operate on these arrays efficiently.
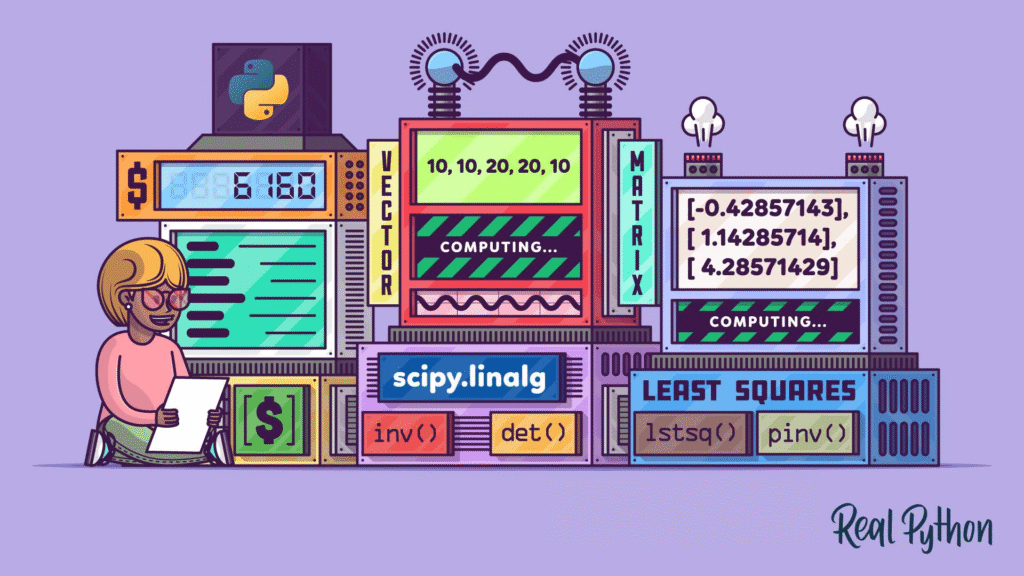
Linalg: Linear algebra
A submodule of NumPy that provides functions for linear algebra operations, such as matrix multiplication, eigenvalue decomposition, and solving linear systems of equations.
Matplotlib:
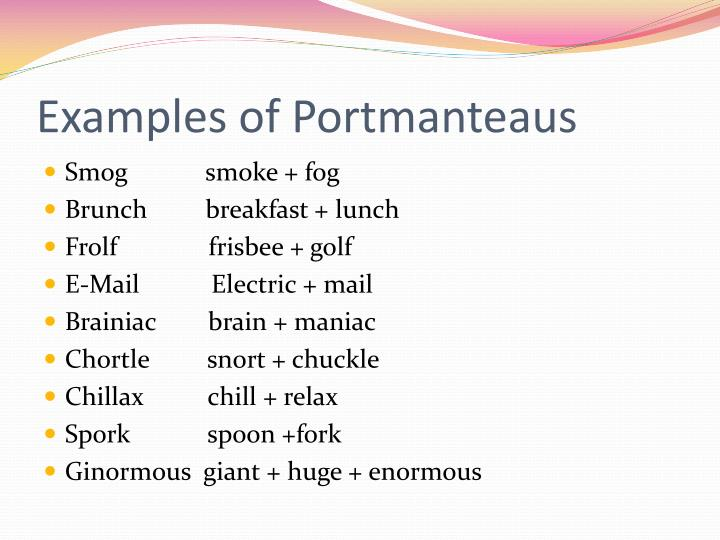
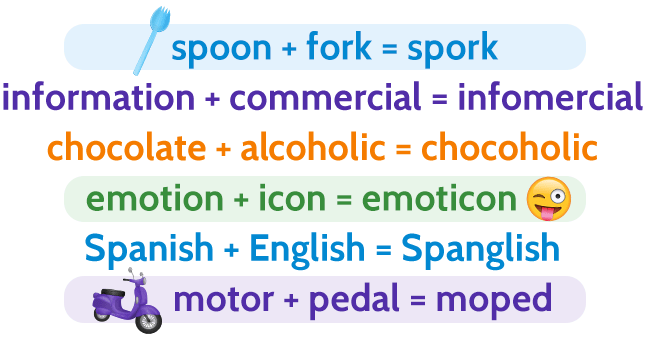
Matplotlib is a portmanteau of “MATLAB”, “plot”, and “library”.
A plotting library that allows users to create static, interactive, and animated visualizations in Python. It provides a wide range of plotting options, including line plots, scatter plots, bar charts, histograms, and more.
Pandas: Panel Data
The Python library Pandas is named after its primary use of handling “Panel Data” and as a reference to “Python Data Analysis”. It was created by Wes McKinney in 2008
A library for data manipulation and analysis. It provides data structures such as Series and DataFrames, which allow users to work with structured data in a convenient and efficient manner.
Scikit-learn: Scientific Toolkit for Machine Learning
Google Summer of Code project by French data scientist David Cournapeau
A machine learning library that provides a wide range of algorithms for classification, regression, clustering, dimensionality reduction, and model selection.
Seaborn:
The Seaborn library in Python was named after the character Samuel Norman Seaborn from the TV show “The West Wing”. The standard alias for Seaborn, “sns,” is derived from the character’s initials
The Python library Seaborn, a powerful tool for creating visualizations, is named after Sam Seaborn. The developer, Michael Waskom, is said to be a fan of “The West Wing” and thus chose to name the library after the character. The library’s common import alias “sns” directly refers to the character’s initials.
The West Wing Character:
Sam Seaborn is a prominent figure in “The West Wing,” portrayed as a brilliant and idealistic young man. He initially works as a speechwriter and later becomes Deputy White House Communications Director, often collaborating with Toby Ziegler. His strong convictions and ability to articulate complex issues make him a beloved character

A data visualization library based on Matplotlib that provides a high-level interface for creating informative and aesthetically pleasing statistical graphics.
TensorFlow:
ensorFlow is named after its core operational mechanism involving tensors and their flow through a computational graph
- Tensors: These are multi-dimensional arrays (like vectors and matrices) that serve as the fundamental data structure in TensorFlow. All computations in TensorFlow are executed using tensors.
- Flow: This refers to the way tensors move through a computational graph. This graph represents a series of operations, where each node is an operation, and the edges represent the flow of tensors between these operations.
Therefore, TensorFlow essentially describes how tensors flow through a defined sequence of operations within its framework.
A framework for building and training machine learning models, particularly deep neural networks. It provides a flexible and scalable platform for developing AI applications.
Keras: A high-level API for building and training neural networks, which can be used with TensorFlow as its backend. Keras simplifies the process of creating complex models and is known for its user-friendliness.
GUI toolkits like Tkinter, wxPython, Qt, or GTK
GUI (Graphical User Interface) Toolkit refers to a collection of software libraries that provide developers with a set of tools to create graphical user.
a form of user interface that allows users to interact with electronic devices through graphical icons and visual indicators such as secondary notation. In many applications, GUIs are used instead of text-based UIs, which are based on typed command labels or text navigation.
Tkinter’s name is derived from “Tk interface”. It serves as the standard Python interface to the Tk GUI toolkit. This toolkit was originally developed for the Tcl scripting language by John Ousterhout.
wxPython
one of the alternatives to Tkinter.
wxPython is a combination of the Python programming language and the wxWidgets toolkit
Interfaces are available for languages like Python, Ruby, Lua, and Perl, allowing development in languages besides C++
wxWidgets is a powerful, cross-platform GUI (Graphical User Interface) library written in C++. It allows developers to create applications that look and feel native on various operating systems like Windows, macOS, and Linux, all from a single codebase. Instead of emulating a GUI, wxWidgets uses the native platform’s API, ensuring a true native experience
The “wx” in wxWidgets stands for Windows and X Window System.
he X Window System (often called X11 or simply X) is a fundamental, network-based, graphical windowing system primarily used on Unix-like operating systems like Linux. I
Qt is a cross-platform application development framework primarily used for creating graphical user interfaces (GUIs) and cross-platform applications. I
GTK (formerly GIMP ToolKit and GTK+) is a free software cross-platform widget toolkit for creating graphical user interfaces (GUIs). It is licensed under the terms of the GNU Lesser General Public License, allowing both free and proprietary software to use it.
What are GTK and Qt?
Both are GUI libraries. Basically if you want to launch a program with text fields, button, etc. these are among the most popular choices. GTK is built with the C programming language and Qt uses C++. The GNOME desktop environment is built using GTK and KDE uses Qt.
An API, or Application Programming Interface, is a set of rules and specifications that defines how software components can interact with each other. It’s essentially a way for one software application to request and receive data or services from another without needing to know the internal details of how that other application works. [1, 2, 3, 4]
Key aspects of APIs:
- Communication Bridge: APIs act as a bridge, allowing different software systems to communicate and exchange data, even if they were developed by different companies or use different technologies. [2, 4, 5, 6]
- Data Exchange: APIs facilitate the sharing of data between applications, enabling features like online banking, social media sharing, and more. [6, 7]
- Standardized Interface: APIs define a specific way for applications to interact, ensuring that they can work together seamlessly. [1, 4]
- Reduced Development Time: By using APIs, developers can avoid reinventing the wheel and leverage pre-existing functionalities, saving time and effort. [7, 8]
- Examples: A common example is the API used by a mobile weather app to get real-time weather data from a weather service, rather than having to build its own weather data collection system. [8, 9, 10, 11]
Regression is a statistical technique that relates a dependent variable to one or more independent variables. A regression model shows whether changes observed in the dependent variable are associated with changes in one or more of the independent variables
| 1st June , 2025 | |
| 12:00 PM – 12:30 PM | Zoom Test Session |
| Week-1 | |
| 2nd June, 2025 | |
| 06:00 PM – 7:30 PM | Lecture 1: Introduction to Artificial Intelligence (AI) Machine Learning (ML) • Overview of AI, ML • Regression • Classification • Supervised Learning • Unsupervised Learning • Deep Learning • Test-Train Split • Metrics |
| 7:30 PM-8:00 PM | Break |
| 8:00 PM – 9:15 PM | Lecture 2: Linear Algebra for AIML • Vector Representation • Inner Product • Orthogonality • Matrices • Matrix Inversion |
| 3rd June, 2025 | |
| 6:00 PM – 7:30 PM | Lecture 3: Linear Regression for AIML • Regression Model • Multiple Regressors • Model Computation • Pseudo inverse • Online Learning |
| 7:30 PM-8:00 PM | Break |
| 8:00 PM – 9:15 PM | Project 1: IRIS Dataset Regression using PYTHON • IRIS Dataset Features • Linear Regression Module • Mean Squared Error (MSE) • R2 Score |
| 4th June, 2025 | |
| Break Day | |
| 5th June, 2025 | |
| 06:00 PM – 07:30 PM | Lecture 4: Logistic Regression-Based AIML • Logistic Function • Class Probabilities • Likelihood and ML • Logistic Regression Metrics • Confusion Matrix |
| 7:30 PM-8:00 PM | Break |
| 8:00 PM – 9:15 PM | Project 2: Boston Housing Price Analysis using PYTHON-Based Regression • Boston Housing set Features • Model Fitting • Model Performance • MSE, R2 Score • Regression Plot |
| 6th June, 2025 | |
| 06:00 PM – 7:30 PM | Lecture 5: Support Vector Classifier (SVC) for Machine Learning • SVM Structure • Maximum Margin Classifier • Convexity and Convex Optimization • Kernel SVM |
| 7:30 PM-8:00 PM | Break |
| 8:00 PM – 9:15 PM | Project 3: SCIKIT Package for Logistic Regression using Purchase/ Shopping Data • Purchase/ Shopping Dataset Features • Logistic Model Fitting • Confusion Matrix Display • Accuracy Score |
| Week-2 | |
| 9th June, 2025 | |
| 06:00 PM – 7:30 PM |